Last week…
…was a great week for U.S. Equities.

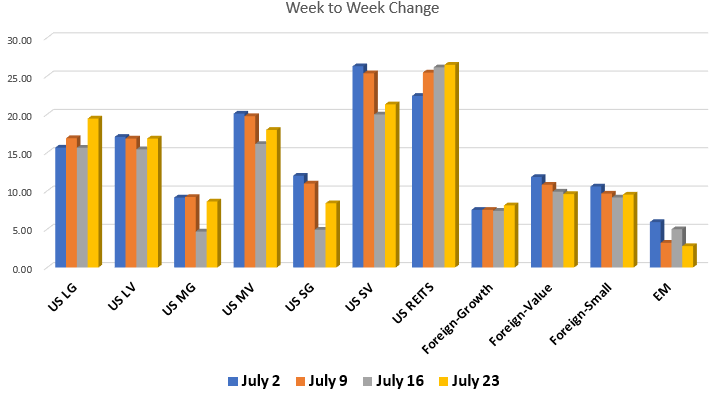
Since September 2020 we have been talking about market rotation, i.e. value companies and small companies have been outperforming growth and large companies. This rotation has continued for most of 2021, but the wave has shifted back now toward larger and more growth firms. Large Growth and Value are now pretty much on an even playing field YTD. Mid Growth & Value as well as Small Growth & Value are evening out but at a slower pace.
US REITS were up a little while Global REITS were down a little. Commodities were up almost 2% from the previous week. We noted Commodities’ YTD return of 22.62% is pretty close to Tech’s return of 23.49 YTD. We haven’t seen Commodities and Tech this close since 2010. Commodities have a lot of room left to grow with their trailing 10 & 15 year returns still in the red.
Foreign was mixed, but no big movement either way. Emerging market is the biggest loser, down 2.2%.
AND five out of our eight bond asset classes are now out of the red YTD. This is the best bonds have looked all year.
Have a great weekend!
All performance reported in this video are from the following index list: DJ Industrial Average TR USD, S&P 500 TR, DJ US TSM Large Cap Growth TR USD, NASDAQ 100, Technology NTTR TR USD, DJ US Health Care TR USD, DJ US TSM Large Cap Value TR USD, DJ US TSM Mid Cap Growth TR USD, DJ US TSM Mid Cap Value TR USD, DJ US TSM Small Cap Growth TR USD, DJ US TSM Small Cap Value TR USD, FTSE NAREIT All Equity REITs TR, DJ Gbl Ex US Select REIT TR USD, Bloomberg Commodity TR USD, MSCI EAFE NR USD, MSCI EAFE Growth NR USD, MSCI EAFE Value NR USD, MSCI EAFE Small Cap NR USD, MSCI EM NR USD, BBgBarc US Corporate High Yield TR USD, FTSE WGBI NonUSD USD, JPM EMBI Plus TR USD, BBgBarc US Govt 1-3 Yr TR USD, ICE BoafAML 1-3Y US Corp TR USD, BBgBarc Intermediate Treasury TR USD, BBgBarc Interm Corp TR, BBgBarc US Treasury US TIPS TR USD. This material has been prepared solely for informational purposes based upon data generally available to the public from sources believed to be reliable. All performance reporting is for indexes, not specific securities. Performance of specific securities will vary from indexes. Past performance is not an assurance of future results. Indexes cited are provided to illustrate market trends for certain asset classes. It is not possible to invest directly in an index. Indexes do not reflect individual investor costs of trading, expense ratios & advisory or other fees