

Last Week – Ending 5/19/2023
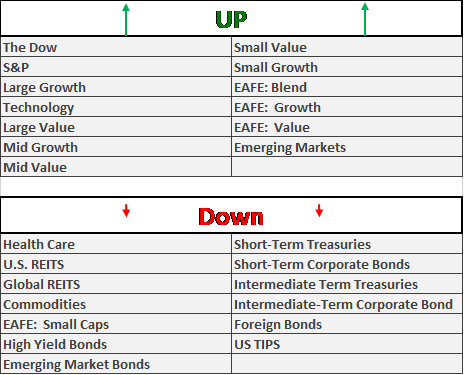
The S&P 500 index rose 1.84% (Total Return) this week as gains led by the technology, communication services and consumer discretionary sectors brought the market benchmark to a fresh 2023 high.
The climb came amid encouraging guidance from some companies and hopes that Congress will reach an agreement on the US debt ceiling soon, though those hopes dimmed a bit on Friday after Republican negotiators halted the talks, saying the White House was being uncooperative.
The S&P 500 reached an intraday high of 4,212.91, its highest level this year. Technology had the largest percentage increase of the week, up 5.6%.
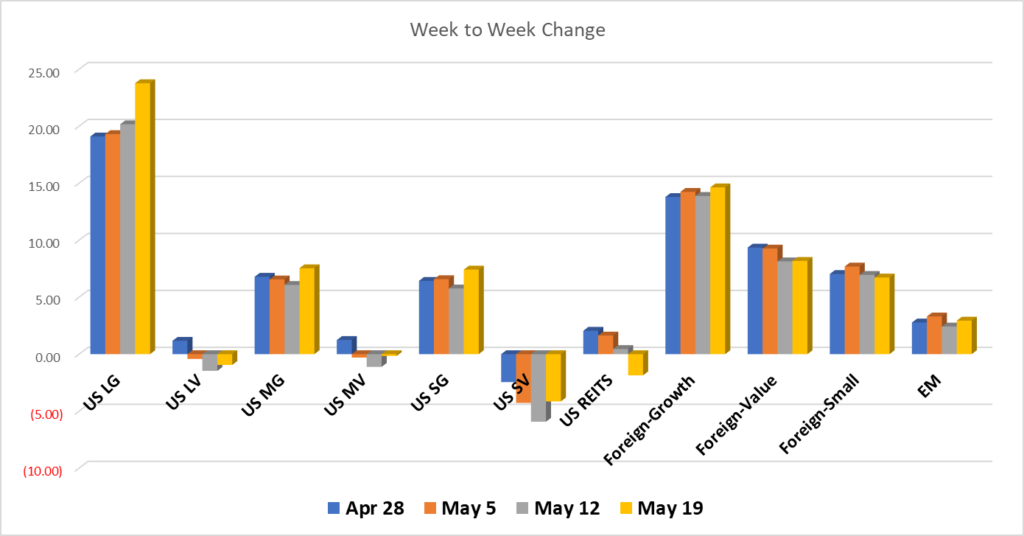
US Large Caps and Growth continued to outpace Small Caps and Value. Large Growth hurdled ahead 3.6% with Large Value moving up just 0.53%. Mid Cap Growth bounded ahead 1.45% leaving Mid Cap Value in the dust, ahead just 0.87%. And, Small Cap Growth bounced out of bed to 1.64% while Small Cap Value got out the door at 1.7% through the week.
Ooops, guess that messed up the pattern!? Small Value not only beat its Small Cap cousin but also its Mid Cap cousins and closely paced Large Cap Growth. And, that’s the point. We look for patterns and trends because they make a difference.
Here’s why. Your Worthwhile Wealth Council team has now managed through five significant bear markets over the past 30+ years. That’s a wealth of experience and data in the form of ‘useful information’! Remember that phrase? It’s one of three essential qualities for long-term investor success. The others are ‘Common Sense’ and ‘Understanding Greed and Fear’ as primary drivers of the markets.
As we invest and rebalance your accounts, we’re constantly noting these trends and patterns against the backdrop of all that experience, data and, – in view of the constant drone of media noise.
Here’s a secret. The media and the markets (think stock exchanges) run on the same fuel: Human greed and fear. These translate into behavioral and market patterns. They are incredibly useful in grounding your portfolio strategy while helping you navigate through what otherwise feels like CHAOS. That constant sense of chaos is what ruins most long term investors and allows your strategy to work for you.
In the moment we write, it’s noteworthy that most bull markets begin with growth stocks in the lead while bear markets tend to favor value stocks. This year, the pattern has been growth leading in tentative but meaningful upturns. During the lagging moments, value has tended to lose less ground. Overall, growth is trouncing value. Yet, this week’s glimmer in small value is intriguing at the least given how far behind it’s fallen year-to-date.
In upcoming Recaps we’ll focus on the year-to-date numbers and what we think these may mean for next bull market and if it’s already quietly begun.
This week, Standard & Poor’s will release its May readings on the US services and manufacturing sectors on Tuesday. Also, the first revision to Q1 gross domestic product is set to be announced on Thursday, along with April pending home sales. Finally, the April personal consumption expenditures index, a closely watched inflation measure, will be released on Friday. That’s going to be quite telling for June’s upcoming meeting of the FED.
Provided by MT Newswires/Worthwhile Wealth Council
All performance reported are from the following index list: DJ Industrial Average TR USD, S&P 500 TR, DJ US TSM Large Cap Growth TR USD, NASDAQ 100, Technology NTTR TR USD, DJ US Health Care TR USD, DJ US TSM Large Cap Value TR USD, DJ US TSM Mid Cap Growth TR USD, DJ US TSM Mid Cap Value TR USD, DJ US TSM Small Cap Growth TR USD, DJ US TSM Small Cap Value TR USD, FTSE NAREIT All Equity REITs TR, DJ Gbl Ex US Select REIT TR USD, Bloomberg Commodity TR USD, MSCI EAFE NR USD, MSCI EAFE Growth NR USD, MSCI EAFE Value NR USD, MSCI EAFE Small Cap NR USD, MSCI EM NR USD, BBgBarc US Corporate High Yield TR USD, FTSE WGBI NonUSD USD, JPM EMBI Plus TR USD, BBgBarc US Govt 1-3 Yr TR USD, ICE BoafAML 1-3Y US Corp TR USD, BBgBarc Intermediate Treasury TR USD, BBgBarc Interm Corp TR, BBgBarc US Treasury US TIPS TR USD. This material has been prepared solely for informational purposes based upon data generally available to the public from sources believed to be reliable. All performance reporting is for indexes, not specific securities. Performance of specific securities will vary from indexes. Past performance is not an assurance of future results. Indexes cited are provided to illustrate market trends for certain asset classes. It is not possible to invest directly in an index. Indexes do not reflect individual investor costs of trading, expense ratios & advisory or other fees. |