

Last week
. . . the S&P 500 index gained 1.1% last week as investors took notice of consumer spending increases while inflation eased in October, and the November job gains were stronger than expected.
The S&P 500 ended November on Wednesday with a 5.4% monthly gain that followed an 8% October jump, marking the first string of back-to-back monthly gains all year. Still the index remains in the red year-to-date with a 15% drop for 2022 and less than a month to go.
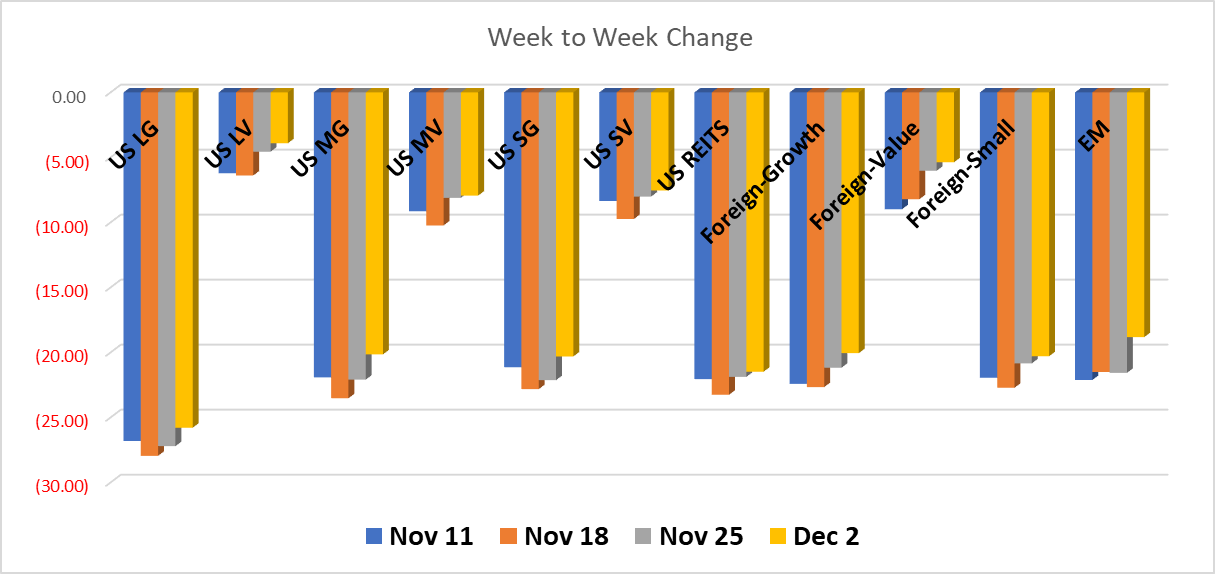
Separating Large Growth from Large Value benchmarks – (the S&P generally represents both), Growth outperformed at 1.4% against Value at just .65% on the week. Yet, year-to-date Large Value is down just -3.9% while Large Growth remains down -25.8%.
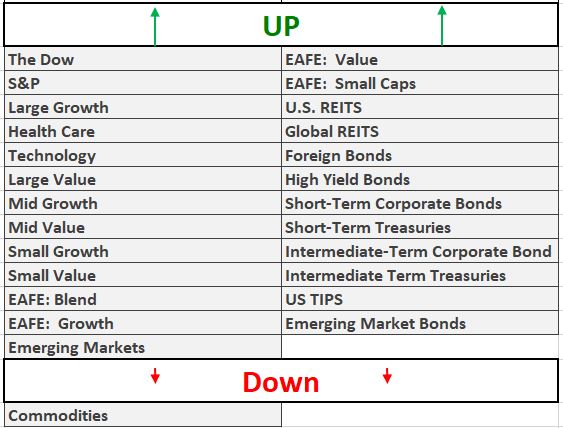
Across all asset classes around the world, we saw another week of gains with the exception of Commodities, down slightly. Notably, Emerging Market stocks advanced the most, surging ahead 2.75%.
All Fixed Income indexes were positive.
This year’s decline is largely due to rising inflation and interest rates for much of 2022. Recent market gains have come over the last two months as investors begin to sense that inflation may have peaked over the summer and the Fed may be signaling the pace of rate increases could soon start slowing.
Last week US consumers were reported spending more in October than in September even as the Federal Reserve’s preferred inflation measure declined. Initially, the market interpreted this this to mean the Fed may back off its historic .75% increases to a .50% increase in its last meeting of the year next week.
Fed Chair Jerome Powell said Wednesday “the time for moderating the pace of rate increases may come as soon as the December meeting.”
How quickly good news turns to bad in the fickle mind of the market reading Fed signaling. On Friday, the Chairman’s remarks were followed by unexpectedly increased wage and jobs growth prompting speculation Powell may have spoken too soon. Ultimately, this too will pass to the review mirror following next week’s meeting – none too soon for our taste!
Have a great weekend!
All performance reported in the graph and performance references are from the following index list: DJ Industrial Average TR USD, S&P 500 TR, DJ US TSM Large Cap Growth TR USD, NASDAQ 100, Technology NTTR TR USD, DJ US Health Care TR USD, DJ US TSM Large Cap Value TR USD, DJ US TSM Mid Cap Growth TR USD, DJ US TSM Mid Cap Value TR USD, DJ US TSM Small Cap Growth TR USD, DJ US TSM Small Cap Value TR USD, FTSE NAREIT All Equity REITs TR, DJ Gbl Ex US Select REIT TR USD, Bloomberg Commodity TR USD, MSCI EAFE NR USD, MSCI EAFE Growth NR USD, MSCI EAFE Value NR USD, MSCI EAFE Small Cap NR USD, MSCI EM NR USD, BBgBarc US Corporate High Yield TR USD, FTSE WGBI NonUSD USD, JPM EMBI Plus TR USD, BBgBarc US Govt 1-3 Yr TR USD, ICE BoafAML 1-3Y US Corp TR USD, BBgBarc Intermediate Treasury TR USD, BBgBarc Interm Corp TR, BBgBarc US Treasury US TIPS TR USD. This material has been prepared solely for informational purposes based upon data generally available to the public from sources believed to be reliable. All performance reporting is for indexes, not specific securities. Performance of specific securities will vary from indexes. Past performance is not an assurance of future results. Indexes cited are provided to illustrate market trends for certain asset classes. It is not possible to invest directly in an index. Indexes do not reflect individual investor costs of trading, expense ratios & advisory or other fees