
Last week…the markets ended on a much more positive note that we observed the previous 2 proceeding weeks.
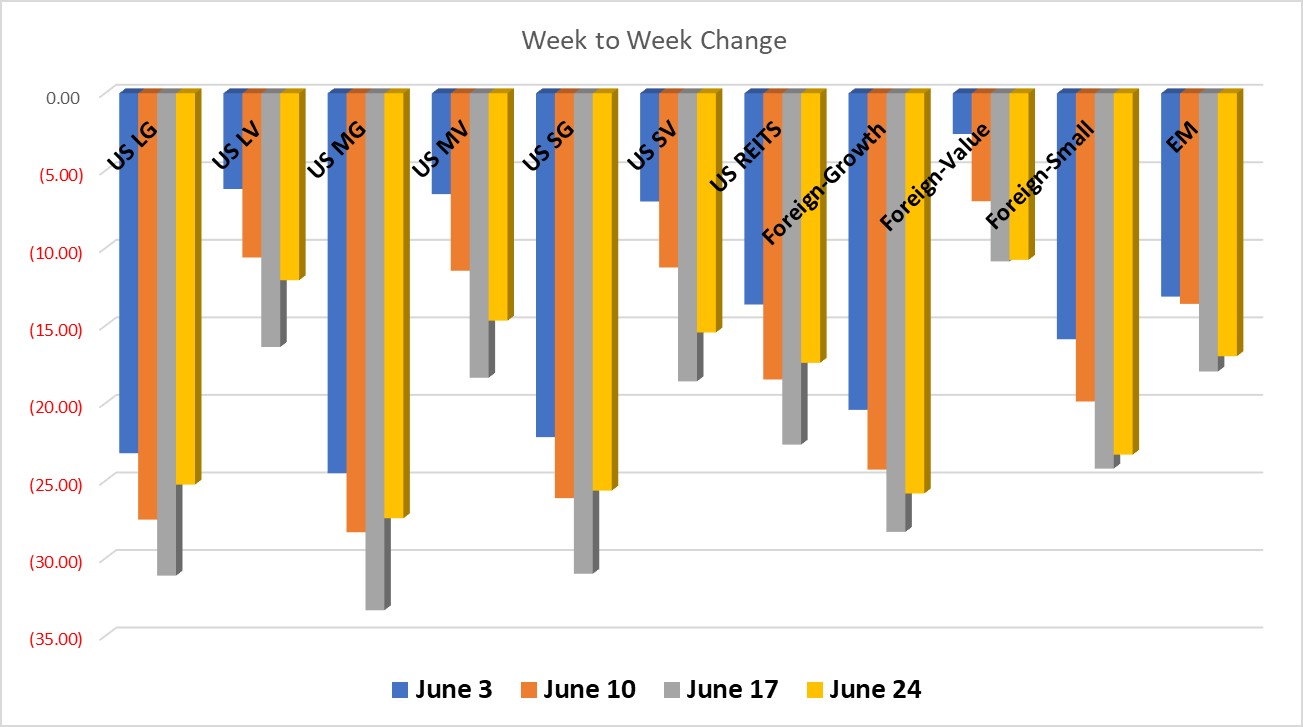
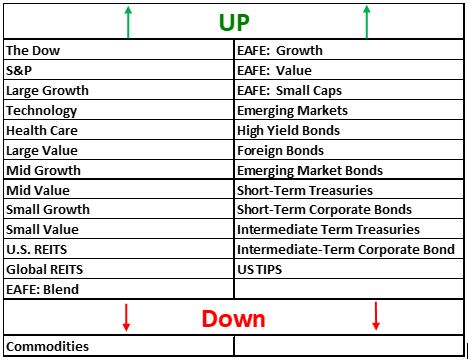
All asset classes, except Commodities were up, and as far as equities went, they were up quite a bit. US Growth companies all jumped over 5% and as demonstrated on the bar graph are now pretty close to or better off than they were two weeks ago. The largest gain last week over all asset classes was held by Health Care, gaining nearly 7%. Health Care now is down less than 10% YTD.
US REITS were also up more than 5% while Global REITS were up less than 1%. And oh, how the mighty have fallen. Commodities were down over 5%, still showing a positive return of over 20%.
Foreign Equities too were up but not nearly as much as US Equities. Foreign did exhibit the same trend with Growth outperforming Value.
Bonds were all up as well, but nothing too crazy. Intermediate Term Treasuries were the top performing gaining 0.57% from last week.
All in all, it was nice to see a bit more black in our report this week.
Have a great weekend!
All performance reported in the graph and performance references are from the following index list: DJ Industrial Average TR USD, S&P 500 TR, DJ US TSM Large Cap Growth TR USD, NASDAQ 100, Technology NTTR TR USD, DJ US Health Care TR USD, DJ US TSM Large Cap Value TR USD, DJ US TSM Mid Cap Growth TR USD, DJ US TSM Mid Cap Value TR USD, DJ US TSM Small Cap Growth TR USD, DJ US TSM Small Cap Value TR USD, FTSE NAREIT All Equity REITs TR, DJ Gbl Ex US Select REIT TR USD, Bloomberg Commodity TR USD, MSCI EAFE NR USD, MSCI EAFE Growth NR USD, MSCI EAFE Value NR USD, MSCI EAFE Small Cap NR USD, MSCI EM NR USD, BBgBarc US Corporate High Yield TR USD, FTSE WGBI NonUSD USD, JPM EMBI Plus TR USD, BBgBarc US Govt 1-3 Yr TR USD, ICE BoafAML 1-3Y US Corp TR USD, BBgBarc Intermediate Treasury TR USD, BBgBarc Interm Corp TR, BBgBarc US Treasury US TIPS TR USD. This material has been prepared solely for informational purposes based upon data generally available to the public from sources believed to be reliable. All performance reporting is for indexes, not specific securities. Performance of specific securities will vary from indexes. Past performance is not an assurance of future results. Indexes cited are provided to illustrate market trends for certain asset classes. It is not possible to invest directly in an index. Indexes do not reflect individual investor costs of trading, expense ratios & advisory or other fees