

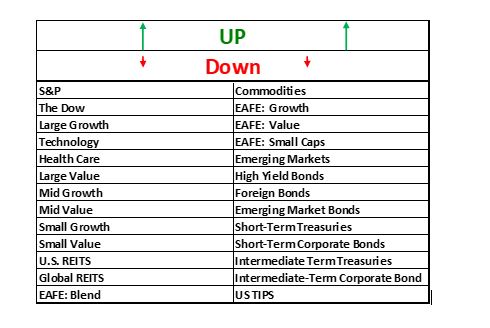
Last week…closed out the first few days of September with all asset classes down from the previous week.
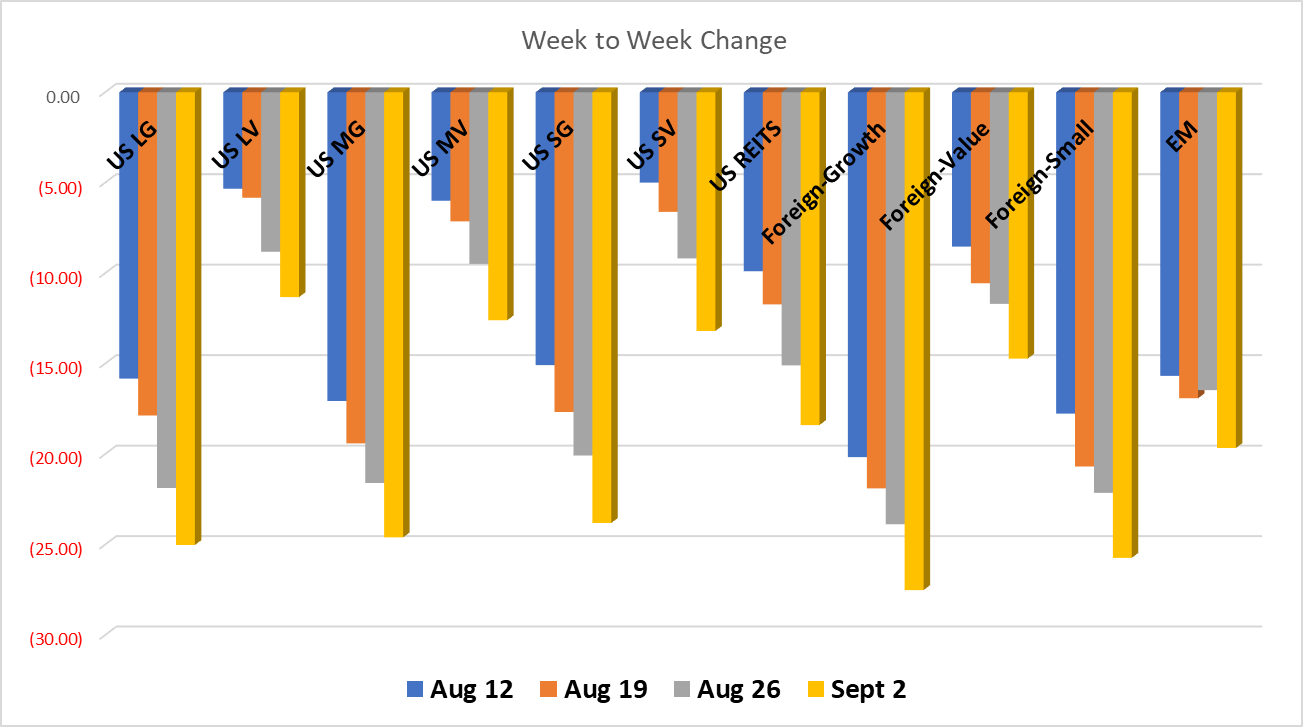
US Equities were all down from 2.5%- over 4% for a pretty bumpy start to September. All US Growth companies are at or pushing pretty close to -25% returns YTD, while Value companies are down between 10-15% YTD. Not exactly exciting numbers as we quickly approach the final quarter of 2022.
There are lots of questions whirling. When will we reach this bottom? How long will this bear market last? What will the recovery look like? We wish we could look into our crystal ball and tell you, but alas we cannot. However, we can look at historical data, but remember, past performance does not guarantee future returns and every bear market is different!
There are different stats out there, but some say from peak to trough the average bear market lasts from 9 months to nearly a year. Just looking at that stat along would send this bear running anywhere from mid-October to mid-December. Again, will that happen? We don’t know, but it is a string of hope to hold on to.
Foreign Equities behaved the same as US Equities. Commodities had the biggest weekly decline, over 5%.
Bonds were all down as well.
Have a great weekend!
All performance reported in the graph and performance references are from the following index list: DJ Industrial Average TR USD, S&P 500 TR, DJ US TSM Large Cap Growth TR USD, NASDAQ 100, Technology NTTR TR USD, DJ US Health Care TR USD, DJ US TSM Large Cap Value TR USD, DJ US TSM Mid Cap Growth TR USD, DJ US TSM Mid Cap Value TR USD, DJ US TSM Small Cap Growth TR USD, DJ US TSM Small Cap Value TR USD, FTSE NAREIT All Equity REITs TR, DJ Gbl Ex US Select REIT TR USD, Bloomberg Commodity TR USD, MSCI EAFE NR USD, MSCI EAFE Growth NR USD, MSCI EAFE Value NR USD, MSCI EAFE Small Cap NR USD, MSCI EM NR USD, BBgBarc US Corporate High Yield TR USD, FTSE WGBI NonUSD USD, JPM EMBI Plus TR USD, BBgBarc US Govt 1-3 Yr TR USD, ICE BoafAML 1-3Y US Corp TR USD, BBgBarc Intermediate Treasury TR USD, BBgBarc Interm Corp TR, BBgBarc US Treasury US TIPS TR USD. This material has been prepared solely for informational purposes based upon data generally available to the public from sources believed to be reliable. All performance reporting is for indexes, not specific securities. Performance of specific securities will vary from indexes. Past performance is not an assurance of future results. Indexes cited are provided to illustrate market trends for certain asset classes. It is not possible to invest directly in an index. Indexes do not reflect individual investor costs of trading, expense ratios & advisory or other fees