

A second week with more good news!
So, why another week setting at least a small positive trend? We’ve talked here about inflation and measures used to track it. It’s THE economic issue all of us are struggling with and certainly is on the market’s mind. One of the indexes tracking inflation is the PCE (Personal Consumption Expenditure) which is less widely covered yet, is the Fed’s preferred index. While CPI (Consumer Price Index) is the media’s preferred measure, the differences are subtle so, suffice it to say that the market knows these differences and pays closest attention to the Fed’s take in these matters.
The FEDs fierce efforts to tame inflation, mainly through key interest rate increases has the market on edge hoping increases aren’t taken too far resulting in a tanked economy. So, any news the Fed might take to mean rate hikes are working, the market will deem “good news”. Last week PCE estimates matched expectations for first time in many months. Whether this is an accurate read of the Fed remains to be seen but, after several ‘bad news’ reports where estimates were off and things looked worse, we’ll give the market credit for responding appropriately if only fleetingly.
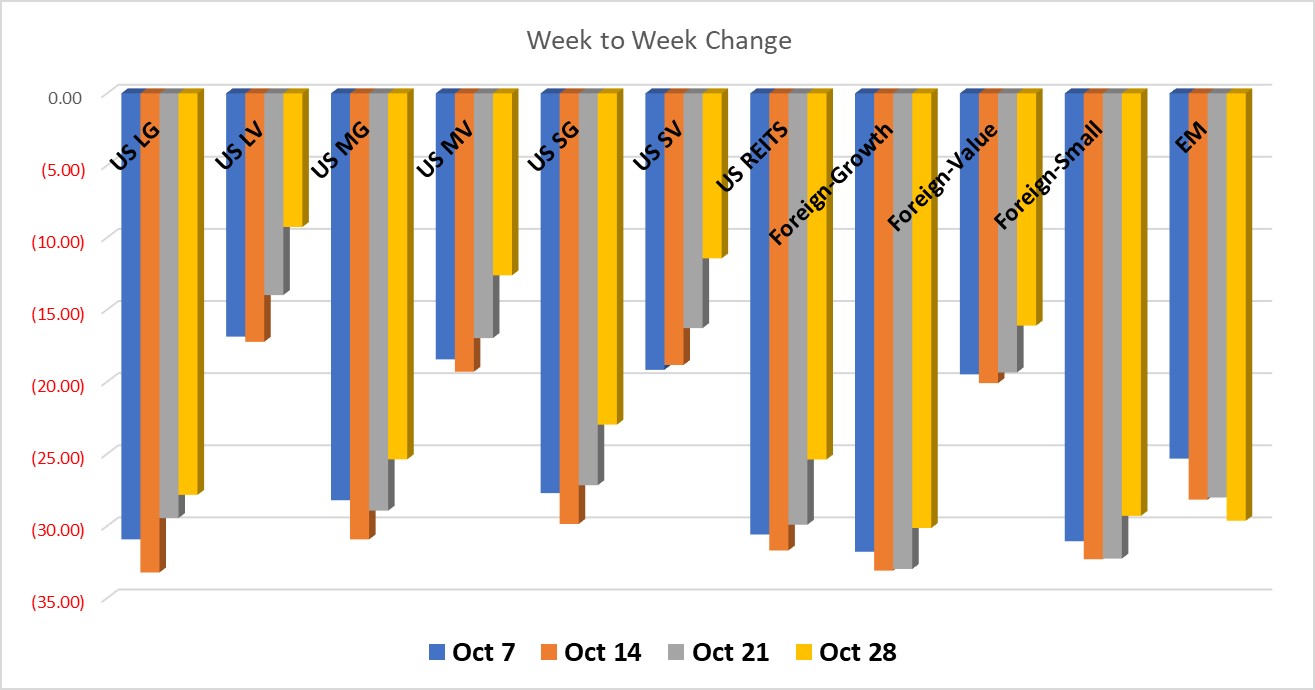
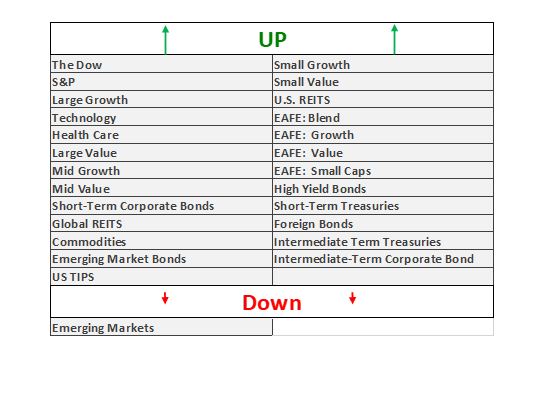
All 24 benchmark indexes we track posted solid gains last week, except Emerging Market stocks. Gains were robust and broad based across the entire market. U.S. equities surged the most with value stocks generally outperforming their growth counterparts. This appeared most strikingly with Large Value outperforming Large Growth by over 3%. Foreign stocks similarly posted gains of 3-3.25% in developed markets.
Finally, Bond indexes that have lost the most ground year-to-date were the strongest performers of the bunch posting of 2% to 2.8%. Other less ‘risky’ fixed income moved ahead yet under 1.0%
Have a great week, and let’s hope to see more of this momentum next week!
All performance reported in the graph and performance references are from the following index list: DJ Industrial Average TR USD, S&P 500 TR, DJ US TSM Large Cap Growth TR USD, NASDAQ 100, Technology NTTR TR USD, DJ US Health Care TR USD, DJ US TSM Large Cap Value TR USD, DJ US TSM Mid Cap Growth TR USD, DJ US TSM Mid Cap Value TR USD, DJ US TSM Small Cap Growth TR USD, DJ US TSM Small Cap Value TR USD, FTSE NAREIT All Equity REITs TR, DJ Gbl Ex US Select REIT TR USD, Bloomberg Commodity TR USD, MSCI EAFE NR USD, MSCI EAFE Growth NR USD, MSCI EAFE Value NR USD, MSCI EAFE Small Cap NR USD, MSCI EM NR USD, BBgBarc US Corporate High Yield TR USD, FTSE WGBI NonUSD USD, JPM EMBI Plus TR USD, BBgBarc US Govt 1-3 Yr TR USD, ICE BoafAML 1-3Y US Corp TR USD, BBgBarc Intermediate Treasury TR USD, BBgBarc Interm Corp TR, BBgBarc US Treasury US TIPS TR USD. This material has been prepared solely for informational purposes based upon data generally available to the public from sources believed to be reliable. All performance reporting is for indexes, not specific securities. Performance of specific securities will vary from indexes. Past performance is not an assurance of future results. Indexes cited are provided to illustrate market trends for certain asset classes. It is not possible to invest directly in an index. Indexes do not reflect individual investor costs of trading, expense ratios & advisory or other fees