
Last week…
…the markets ended the year mostly adding to prior gains. This weeks’ graph includes a bar for 2020’s full year returns illustrating the dramatic rotation seen throughout 2021.
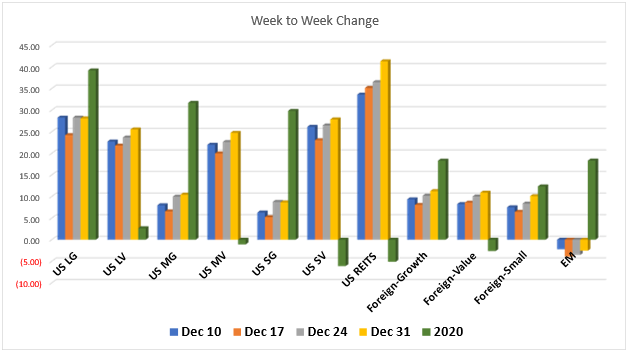
We note especially the craters out of which Value stocks and Small Value stocks in particular, climbed from year-end 2020 to end of 2021. The gap was all but closed between Large Growth and Large Value; Mid Cap Value more than doubled Mid Cap Growth and Small Cap Value which ended 2020 6% in the red, more than tripled its cousin, Small Growth in 2021.
The same was seen for US Equity REITS and Commodities. US REITS were negative 5% in 2020 and finished the winner for all equities tracked at 41% in 2021. And, Commodities which have struggled to repair long term negatives and were down 3% in 2020, finished at 27% in 2021. Commodities also pulled into positive territory for the five-year trailing average and sits on the cusp of turning positive for its 10- and fifteen-year trailing return.
Foreign Equities all finished the year on an up note leaving only Emerging Markets in the red for the year at – 2.5% after 2020’s 18%-year end. Foreign Small Caps again finished the week and the year strong ending above 10%.
After a strong year in 2020, bonds underperformed against rising yields and inflation finishing negative for all except US Treasury TIPS at just below 6% and High Yield Corps at 5.3%. Last year’s second place performer, Foreign Bonds was 2021’s loser diving 20% to finish -9.7%. Emerging Market Bonds plunged half that from 7% in 2020 to negative 5% ending 2021.
Look for more on expectations for the markets in this new year!
Happy New Year and have a great weekend!
All performance reported in the graph and performance references are from the following index list: DJ Industrial Average TR USD, S&P 500 TR, DJ US TSM Large Cap Growth TR USD, NASDAQ 100, Technology NTTR TR USD, DJ US Health Care TR USD, DJ US TSM Large Cap Value TR USD, DJ US TSM Mid Cap Growth TR USD, DJ US TSM Mid Cap Value TR USD, DJ US TSM Small Cap Growth TR USD, DJ US TSM Small Cap Value TR USD, FTSE NAREIT All Equity REITs TR, DJ Gbl Ex US Select REIT TR USD, Bloomberg Commodity TR USD, MSCI EAFE NR USD, MSCI EAFE Growth NR USD, MSCI EAFE Value NR USD, MSCI EAFE Small Cap NR USD, MSCI EM NR USD, BBgBarc US Corporate High Yield TR USD, FTSE WGBI NonUSD USD, JPM EMBI Plus TR USD, BBgBarc US Govt 1-3 Yr TR USD, ICE BoafAML 1-3Y US Corp TR USD, BBgBarc Intermediate Treasury TR USD, BBgBarc Interm Corp TR, BBgBarc US Treasury US TIPS TR USD. This material has been prepared solely for informational purposes based upon data generally available to the public from sources believed to be reliable. All performance reporting is for indexes, not specific securities. Performance of specific securities will vary from indexes. Past performance is not an assurance of future results. Indexes cited are provided to illustrate market trends for certain asset classes. It is not possible to invest directly in an index. Indexes do not reflect individual investor costs of trading, expense ratios & advisory or other fees