
Last week…
The day to day market volatility continued, BUT…
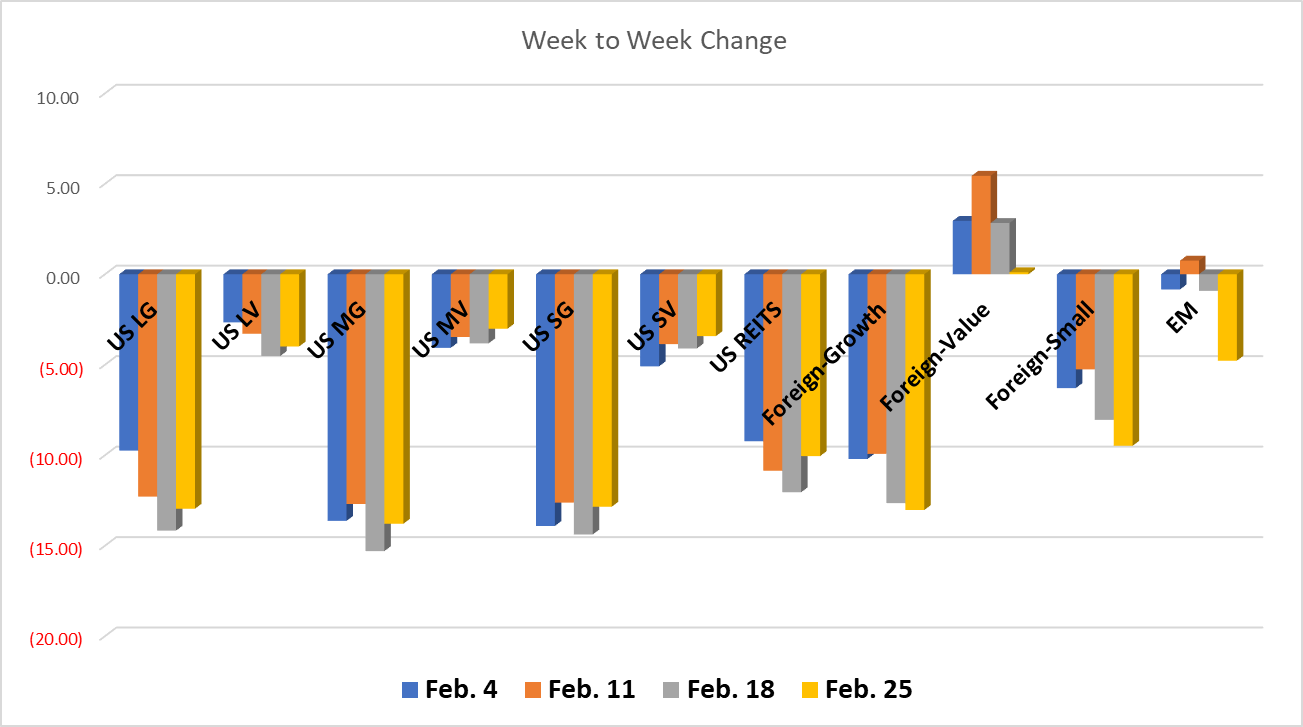
…we came out of the week with more positive momentum than negative. Only 2 asset classes that are positive YTD, however, all US Equities were up from the previous week, so we’re moving in the right direction, right? This week there is a discernable pattern, Growth stocks outperformed Value stocks with Small Growth outperforming both Large and Mid. You can see in the bar graph that Large, Mid and Small Growth companies are all very close with YTD returns. The same can be said for Large, Mid and Small Value Companies.
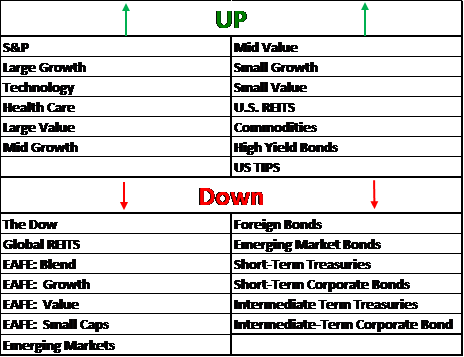
US Health was our biggest week to week gain of 2.5% with US REITS close behind at 2%. Global REITS were down.
Commodities continue their upward tick, holding strong onto to leader spot for YTD Returns, now at over13% YTD.
While US Equities gained, Foreign Equities were not as fortunate and were all down from the previous week, most likely due to the unsettling Russian invasion of Ukraine.
And as far as bonds go, only two were up – High Yield and TIPS.
Have a great weekend!
All performance reported in the graph and performance references are from the following index list: DJ Industrial Average TR USD, S&P 500 TR, DJ US TSM Large Cap Growth TR USD, NASDAQ 100, Technology NTTR TR USD, DJ US Health Care TR USD, DJ US TSM Large Cap Value TR USD, DJ US TSM Mid Cap Growth TR USD, DJ US TSM Mid Cap Value TR USD, DJ US TSM Small Cap Growth TR USD, DJ US TSM Small Cap Value TR USD, FTSE NAREIT All Equity REITs TR, DJ Gbl Ex US Select REIT TR USD, Bloomberg Commodity TR USD, MSCI EAFE NR USD, MSCI EAFE Growth NR USD, MSCI EAFE Value NR USD, MSCI EAFE Small Cap NR USD, MSCI EM NR USD, BBgBarc US Corporate High Yield TR USD, FTSE WGBI NonUSD USD, JPM EMBI Plus TR USD, BBgBarc US Govt 1-3 Yr TR USD, ICE BoafAML 1-3Y US Corp TR USD, BBgBarc Intermediate Treasury TR USD, BBgBarc Interm Corp TR, BBgBarc US Treasury US TIPS TR USD. This material has been prepared solely for informational purposes based upon data generally available to the public from sources believed to be reliable. All performance reporting is for indexes, not specific securities. Performance of specific securities will vary from indexes. Past performance is not an assurance of future results. Indexes cited are provided to illustrate market trends for certain asset classes. It is not possible to invest directly in an index. Indexes do not reflect individual investor costs of trading, expense ratios & advisory or other fees