Last Week…
…the majority of asset classes experienced a pullback.

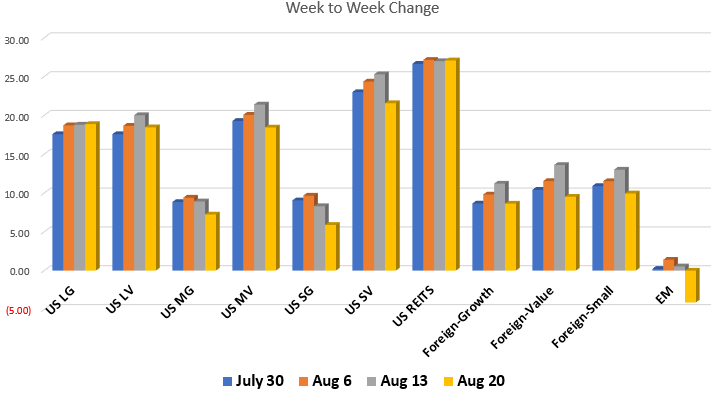
US Equities exhibited the same pattern as reported last week. Growth outperformed Value while Large companies overall did better than Mid and Small. In fact:
- Large Growth was barely up 0.08%
- Health Care was up 0.19%
- Technology was up nearly 2%
- Other US Equities were downy anywhere from 1.5% to nearly 4%
US REITS were up the same as Large Growth – 0.08%. And that’s the end of any Equities that were up from the previous week.
Foreign Equities experienced a larger sell off than the US.
- Growth was down over 2.5%
- Value was down over 4%
- Small Caps were down over 3%
The two asset classes taking the biggest hits though were Commodities, down over 5% and Emerging Markets down over 4.6%.
With all the negative movement in equities, do you supposed bonds stepped up to bat? Nope! Bonds barely budged yet again. The biggest movement occurred in TIPS, down 0.41% from the previous week. Emerging Market Bonds and Intermediate Term Treasuries moved up but barely.
Have a great weekend!
All performance reported in this video are from the following index list: DJ Industrial Average TR USD, S&P 500 TR, DJ US TSM Large Cap Growth TR USD, NASDAQ 100, Technology NTTR TR USD, DJ US Health Care TR USD, DJ US TSM Large Cap Value TR USD, DJ US TSM Mid Cap Growth TR USD, DJ US TSM Mid Cap Value TR USD, DJ US TSM Small Cap Growth TR USD, DJ US TSM Small Cap Value TR USD, FTSE NAREIT All Equity REITs TR, DJ Gbl Ex US Select REIT TR USD, Bloomberg Commodity TR USD, MSCI EAFE NR USD, MSCI EAFE Growth NR USD, MSCI EAFE Value NR USD, MSCI EAFE Small Cap NR USD, MSCI EM NR USD, BBgBarc US Corporate High Yield TR USD, FTSE WGBI NonUSD USD, JPM EMBI Plus TR USD, BBgBarc US Govt 1-3 Yr TR USD, ICE BoafAML 1-3Y US Corp TR USD, BBgBarc Intermediate Treasury TR USD, BBgBarc Interm Corp TR, BBgBarc US Treasury US TIPS TR USD. This material has been prepared solely for informational purposes based upon data generally available to the public from sources believed to be reliable. All performance reporting is for indexes, not specific securities. Performance of specific securities will vary from indexes. Past performance is not an assurance of future results. Indexes cited are provided to illustrate market trends for certain asset classes. It is not possible to invest directly in an index. Indexes do not reflect individual investor costs of trading, expense ratios & advisory or other fees