
Last week…yielded the best report we have seen in quite some time.
Prior to last week’s closing, the S&P faced the most consecutive DOWN closing weeks in over 20 years. Last week closed out the best performing week since November of 2020. Of course, we have quite the road of recovery ahead, if we indeed scrapped the bottom and are beginning our bounce back up.
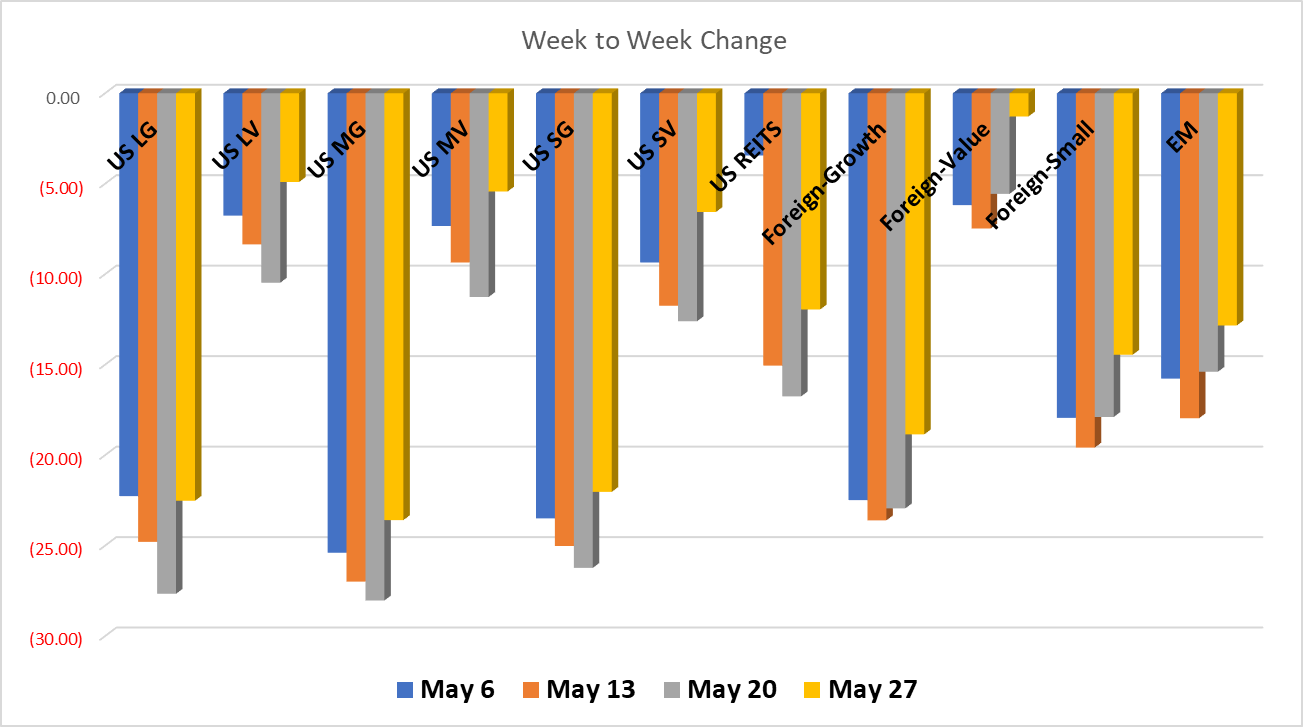
US Equities bounced back the most with value overall outperforming growth with small companies performing better than large. Small Value was up the most of any asset class, over 6% from last week. Large Growth outperformed Mid and Small Growth.
US RETIS were up almost 5% with Global RETIS up over 2.5%. Commodities continued to climb higher, now with over 35% return YTD.
Foreign Equities were up over 4% with exception of Small Caps which were up nearly 3.5%. Even Emerging Markets nudged up over 2.5%.
Bonds also nudged up a bit. High Yield bonds were up nearly 3% and Emerging Market Bonds were up over 2%. Overall, a great week for the market!
Have a great weekend!
All performance reported in the graph and performance references are from the following index list: DJ Industrial Average TR USD, S&P 500 TR, DJ US TSM Large Cap Growth TR USD, NASDAQ 100, Technology NTTR TR USD, DJ US Health Care TR USD, DJ US TSM Large Cap Value TR USD, DJ US TSM Mid Cap Growth TR USD, DJ US TSM Mid Cap Value TR USD, DJ US TSM Small Cap Growth TR USD, DJ US TSM Small Cap Value TR USD, FTSE NAREIT All Equity REITs TR, DJ Gbl Ex US Select REIT TR USD, Bloomberg Commodity TR USD, MSCI EAFE NR USD, MSCI EAFE Growth NR USD, MSCI EAFE Value NR USD, MSCI EAFE Small Cap NR USD, MSCI EM NR USD, BBgBarc US Corporate High Yield TR USD, FTSE WGBI NonUSD USD, JPM EMBI Plus TR USD, BBgBarc US Govt 1-3 Yr TR USD, ICE BoafAML 1-3Y US Corp TR USD, BBgBarc Intermediate Treasury TR USD, BBgBarc Interm Corp TR, BBgBarc US Treasury US TIPS TR USD. This material has been prepared solely for informational purposes based upon data generally available to the public from sources believed to be reliable. All performance reporting is for indexes, not specific securities. Performance of specific securities will vary from indexes. Past performance is not an assurance of future results. Indexes cited are provided to illustrate market trends for certain asset classes. It is not possible to invest directly in an index. Indexes do not reflect individual investor costs of trading, expense ratios & advisory or other fees