
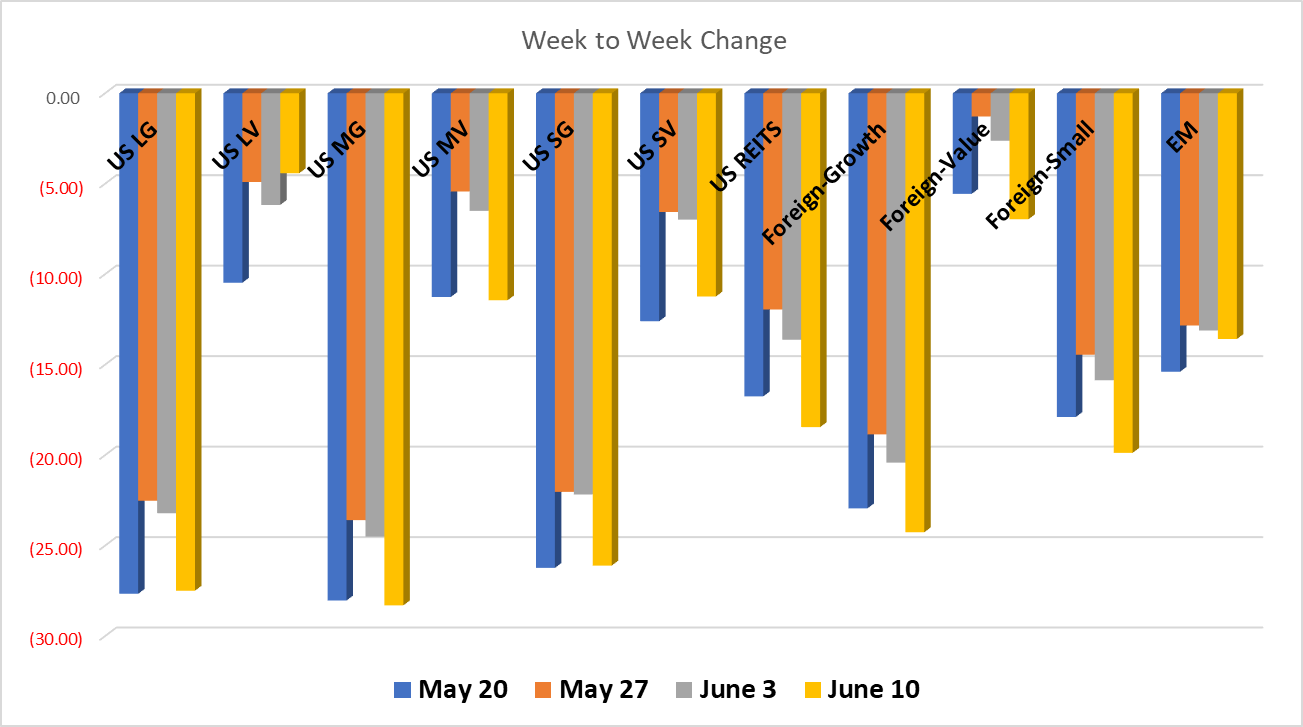
Last week…was a repeat of the week before, only worse –
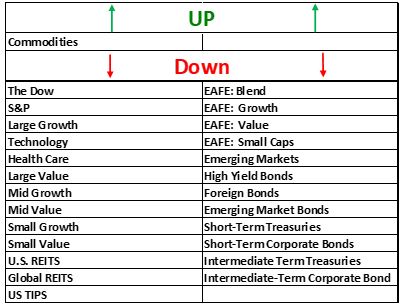
Again, all asset classes lost ground except one; this time it was Commodities, the all-out performer so far this year, trading places with Treasury TIPS. Most likely the anticipated, then announced CPI inflation report was all the ‘bears’ needed to hear for pile-on selling with the news implying tougher tightening policy from the Fed.
But wait! We thought the Fed’s favorite measure – PCE (Personal Consumption Expenditures) reported earlier and showing a hint of cooling off was good news. That’s the thing about periods of heightened volatility – good news frequently morphs into bad news then back in to good news again before you know it. This is why trying to rationalize the market’s short-term shifts is frequently pointless.
US Equities took this news harder last week; mostly giving back the rest of the late May rally and then some.
At this point, long term investors need historical perspective about bear markets and asset class divergence. It’s worth noting that US Value stocks have not only held up strikingly well through this year’s volatility but, have significantly outperformed US Growth stocks since the end of 2020. For example, over the past two-year period ending last Friday the divergence between the average annual returns for US Mid Cap Growth stocks and US Mid Cap Value stocks is a whopping 13.54% – 2.24% (MG), 15.78% (MV)! (That’s not cumulative, but the average annual return.)
And, that gap is even greater between US Small Cap Growth and US Small Cap Value at 13.74% with Small Value outperforming all US Equities for the period at 18.68%!
This is critical to understanding your money in this market during this period. There are numerous examples of these divergences that offset the blaring drone of gloom and doom across all media and especially money media. Without this perspective most investors are left to scrambling and scrapping their investment strategy and wiping out progress they don’t even know they may have in their portfolios.
We are profoundly aware of the discipline our clients consistently display during times like this. And we want you all to know it! Many, if not most of our professional peers are spending most of their hours lately fielding frightened calls from their clients. We know the reason that we’re not is the confidence you’ve built through your participation in our process of developing your investment policy and strategy.
But, please don’t let this prevent you from touching base with us! If you’d like to learn more about your particular account and these divergences, please drop us an email or call at any time. We’ll be happy to walk you through it!
Have a great weekend!
All performance reported in the graph and performance references are from the following index list: DJ Industrial Average TR USD, S&P 500 TR, DJ US TSM Large Cap Growth TR USD, NASDAQ 100, Technology NTTR TR USD, DJ US Health Care TR USD, DJ US TSM Large Cap Value TR USD, DJ US TSM Mid Cap Growth TR USD, DJ US TSM Mid Cap Value TR USD, DJ US TSM Small Cap Growth TR USD, DJ US TSM Small Cap Value TR USD, FTSE NAREIT All Equity REITs TR, DJ Gbl Ex US Select REIT TR USD, Bloomberg Commodity TR USD, MSCI EAFE NR USD, MSCI EAFE Growth NR USD, MSCI EAFE Value NR USD, MSCI EAFE Small Cap NR USD, MSCI EM NR USD, BBgBarc US Corporate High Yield TR USD, FTSE WGBI NonUSD USD, JPM EMBI Plus TR USD, BBgBarc US Govt 1-3 Yr TR USD, ICE BoafAML 1-3Y US Corp TR USD, BBgBarc Intermediate Treasury TR USD, BBgBarc Interm Corp TR, BBgBarc US Treasury US TIPS TR USD. This material has been prepared solely for informational purposes based upon data generally available to the public from sources believed to be reliable. All performance reporting is for indexes, not specific securities. Performance of specific securities will vary from indexes. Past performance is not an assurance of future results. Indexes cited are provided to illustrate market trends for certain asset classes. It is not possible to invest directly in an index. Indexes do not reflect individual investor costs of trading, expense ratios & advisory or other fees